California Offshore Wind Energy Modeling Platform
Powered By
EEMS Online
  • Home
  • Introduction
  • Learn About the Models and Applications
  • Explore the Models
  • Input Data
  • Input Data
login

Spatial Models for CA Offshore Wind Energy Planning

Providing data-driven support for sustainable renewable energy development

Welcome to the California Offshore Wind Energy Modeling Platform

Offshore wind energy developed in federal ocean waters off California is poised to help the state achieve its 100% renewable and zero-carbon energy goals. Since 2016, the State has coordinated with governmental partners, including the Bureau of Ocean Energy Management (BOEM) and the BOEM-California Renewable Energy Intergovernmental Task Force, to identify areas off the state’s coast suitable for potential offshore wind energy development. To support this effort, the Conservation Biology Institute (CBI) used data from the California Offshore Wind Energy Gateway to produce a robust set of spatial models, designed to synthesize information to help stakeholders and decision-makers assess the suitability of offshore wind energy development in federal waters off the coast of California. The California Offshore Wind Energy Modeling Platform provides an interface where stakeholders and decision-makers can interact with, examine, and explore these models and their data sources, in order to help support decision-making processes. These models, created using the Environmental Evaluation Modeling System (EEMS), provide a transparent and data-driven means for assessing a range of considerations at a given location, such as energy potential, deployment feasibility, ocean uses, fisheries, and marine life occurrence. BOEM's aliquots are utilized as analysis units to maximize alignment with the leasing process. Together, these models can be used to inform planning processes for offshore wind energy development, to maximize renewable power generation and to help avoid or minimize potential impacts to existing ocean uses and the environment.

The California Offshore Wind Energy Modeling Platform provides an interface where stakeholders and decision-makers can interact with, examine, and explore these models and their data sources, in order to help support decision-making processes. For more information, click on the Learn About the Models tab, or click on the Explore the Models tab to dive right in.

Partners

The California Offshore Wind Modeling Platform was developed with support from the following agencies and organizations:

A Primer on EEMS & Fuzzy-Logic

The models presented on the next tab were created using the Environmental Evaluation Modeling System (EEMS), a fuzzy-logic modeling system developed by the Conservation Biology Institute (CBI). Simply put, fuzzy-logic allows you to assign shades of gray to thoughts and ideas rather than being limited to the binary (true/false) determinations of traditional logic. It is this concept of "partial truth" which allows fuzzy-logic models to more accurately capture and resemble human patterns of thought.
EEMS fuzzy-logic models are hierarchical — that is, data flows from the bottom up in order to answer a primary question at the top of the hierarchy. Each node (box) in the hierarchy represents a proposition. A proposition is simply a statement that can either be totally true (+1), totally false (-1), or somewhere in-between at any given location. For example, if the proposition is "High Wind Energy Potential", a value of +1 at a specific location would indicate that this statement is totally true at that location (i.e., that there is definitely a high wind energy potential). A value of -1 at a different location would indicate that this statement is totally false (i.e., that there is definitely NOT a high wind energy potential). And values in between -1 and +1 simply represent degrees of truth along a continuum (the gray areas), and can be interpreted as follows:
  • Values greater than Ø indicate that the proposition is more true than false.
  • Values equal to Ø indicate that the proposition is neither true nor false.
  • Values less than Ø indicate that the proposition is more false than true.

The fuzzy (truth) values for each proposition get combined up the tree using various fuzzy-logic operators (e.g., OR, AND, UNION) in order to calculate the fuzzy value for the node directly above. In the example model diagram shown above, we are taking the average (UNION) of "High Annual Wind Energy Potential" and "High Monthly Wind Energy Potential" to determine whether or not there is a "High Wind Energy Potential". The numerical values in the boxes represent what the fuzzy values might be at a hypothetical location.

For more information on EEMS and fuzzy-logic, visit the EEMS website and/or download the EEMS user manual.

About the Offshore Wind Models

Clicking on the Explore the Models tab brings up an interactive model diagram on the left and a map display on the right. There are four main categories of models to choose from:
  • Wind Energy Potential
  • Deployment Feasibility
  • Existing Ocean Use
  • Environmental Considerations
Dark green areas in the map show where the final proposition is true (on a gradient from 0 to 1).
Yellow areas in the map show where the final proposition is false (on a gradient from 0 to -1).
Light green areas in the map show where the final proposition is neither true nor false.

Proposition: High Deployment Feasibility
Totally FalseSomewhat FalseSomewhat TrueTotally True

Exploring the Model Diagram

  • Click on a box (node) in the model diagram to display the corresponding layer in the map.
  • Click in the map to see the fuzzy (truth) values calculated for each node (these values allow you to determine which factors have the most influence on the things above it).

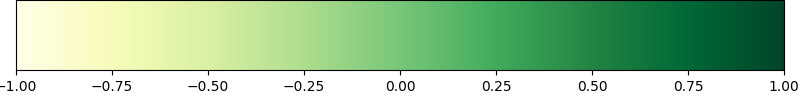
The nodes at the very bottom of the tree (the dark gray boxes) represent the original input data. When building a model, all of the input data, regardless of type (ordinal, nominal, or continuous), are first converted into fuzzy values between -1 (false) and +1 (true). This is typically done by setting a True Threshold (a value that indicates when a proposition becomes totally true) and a False Threshold (a value that indicates when a proposition becomes totally false). Input values between these two thresholds receive a decimal value between -1 and +1 based on a linear interpolation.

Once all of the input data has been converted into "fuzzy space", the resulting nodes are combined up the tree using fuzzy logic operators (e.g., AND, OR, UNION). The operator used to combine a set of input nodes appears at the bottom of the output node.

Applications

The set of models provides a powerful tool to visualize key publicly available data to provide information on geographic distribution of species occurrence and ocean use, relevant to offshore wind energy deployment in California. It is a useful line of evidence to highlight areas with maximum offshore wind energy potential and infrastructure deployment feasibility, as well as areas with high existing ocean uses and marine life occurrence relative to input data values across the statewide range. Values and patterns indicate where there might be interactions, but not necessarily impacts.

It is also important to understand the limitations of these models, in part dictated by data availability. The models do not provide a sensitivity or vulnerability evaluation and should not be used to identify or assess project-level impacts, including NEPA or CEQA analyses. Additionally, datasets reflect currently understood geographic distribution of species occurrence and ocean use and do not take into account climate change and species shifting ranges. The focus of the project was on federal waters off California and should not be used to assess activities in state waters or areas beyond California.

Model Inputs

« Back
This section describes the data and methods used to create the inputs to the EEMS fuzzy logic model.
  • Original
  • Modified
1
Select a model:
Explore and modify the model below
2

Running EEMS...
3
Map Quality
4

Drag n' Drop a CSV

« Back
You can drag and drop a CSV file containing lat/lon coordinates directly into the map. Clicking on any of the points will display all the values in the CSV for that point, as illustrated below. This allows you to examine point data representing a phenomenon of interest in relation to the EEMS model results.

The CSV file should be structured as follows:

ID,Lat,Lon,Var1,Var2,Var3,etc...
1,30.0,-143.0,1,A,2.0,etc...
2,30.1,-142.9,2,B,3.0,etc...

There are a few requirements to be aware of:

  1. Lat/Lon values should be in WGS84.
  2. The first three fields in the CSV file must be as follows: an ID field, a Latitude field, a Longitude field. Any number of attribute fields may follow.
  3. The CSV must include field headers, but the header names can be whatever you wish (e.g., the ID field could be called ID or OID or PointID, and the latitude field could be called Lat or Latitude or Y, etc.)
  4. The size of the points will reflect the value in the first "Var" field (i.e., the field after the longitude field). For that reason, your first "Var" field must contain numeric values (integer or float).

That's it! Once you have a CSV that meets the requirements above, simply drag it into the map.

© 2021 Conservation Biology Institute